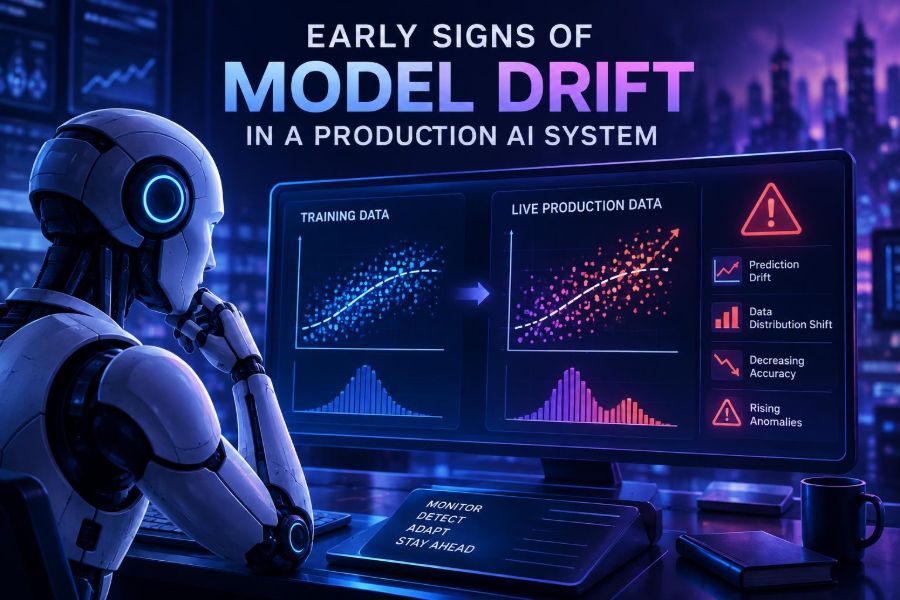

An AI system can look reliable in a demo, pass its launch checks, and then quietly become less useful after deployment. The model may not have changed at all. Instead, the world around it changed: customers wrote differently, products evolved, a data pipeline shifted, or a new policy altered the meaning of a label.
This problem is called model drift, and it matters more as teams put language models, classifiers, recommenders, forecasting models, and retrieval systems into real workflows. A small decline can become a large operational issue when AI influences support tickets, risk decisions, content moderation, or software delivery.
Drift is not one graph falling below one magic threshold. It is a pattern of changes across inputs, outputs, user behavior, business outcomes, and system health. The earliest signals are often indirect: more edits, longer conversations, growing abstention rates, or a strange shift in the distribution of model scores.
After reading this guide, you will be able to define a production baseline, select early-warning metrics, instrument an AI workflow, investigate suspicious changes, and choose a proportionate response before a slow decline becomes an incident.
🧭 1. Understand what model drift really means
Model drift occurs when the relationship between a model, its inputs, and the real-world outcome changes over time. Put simply, the system learned from one environment but is now operating in a somewhat different one.
The phrase is often used broadly, but separating the types of change makes debugging much faster.
| Change type | What changed | Early example | Likely response |
|---|---|---|---|
| Data drift | Input distribution | Support messages become much longer | Inspect ingestion and refresh examples |
| Concept drift | Meaning of inputs or outcomes | “Urgent” now maps to a new escalation policy | Relabel and retrain or update rules |
| Prediction drift | Output distribution | Far more tickets are marked high priority | Audit prompts, thresholds, and model behavior |
| Performance drift | Quality against ground truth | Resolved cases reveal lower accuracy | Validate, remediate, and monitor recovery |
| Operational drift | Workflow or technical environment | Latency rises after a retrieval index change | Fix infrastructure or integrations |
A shift is not automatically bad. A seasonal sales peak may legitimately change demand. Drift becomes a problem when it harms quality, safety, cost, fairness, or the user experience.
🔍 2. Separate drift from a bad initial launch
A weak model at launch is not drifting; it is simply underperforming. Drift describes movement away from an established, acceptable baseline.
This distinction changes the response. If the system was never good enough, collecting more production telemetry will not replace the need for better task design, data, evaluation, or human review.
- Launch issue: failure patterns were visible in pre-production evaluation.
- Drift issue: those patterns or rates worsened after a stable period.
- Observability gap: nobody can tell because baseline evidence was never recorded.
Before declaring drift, verify the comparison window, data completeness, and evaluation method. A new dashboard or altered logging schema can manufacture a false alarm.
📏 3. Define “good” before you deploy
You cannot detect a meaningful decline if “good” is only a vague feeling. Translate product expectations into measurable service objectives for the AI task.
For a document extraction system, quality may mean field accuracy, citation coverage, and the percentage sent to human review. For an assistant, it may mean task completion, factual support, safe refusals, user edits, and response latency.
AI use case: classify incoming billing requests
Primary quality metric: correct routing rate
Guardrail metric: harmful misroute rate
Operational metric: p95 response time
Experience metric: agent override rate
Business metric: time to first useful action
Set a baseline using a representative period, not one unusually quiet day. Record the median and natural variation for each metric, then decide which change deserves attention.
🗂️ 4. Build a baseline that you can reproduce
A baseline is a frozen description of what normal operation looked like. It should include more than a single accuracy number.
- Model, prompt, tool, retrieval, and policy configuration identifiers.
- Input characteristics such as language, length, source, format, and missing fields.
- Output characteristics such as class, confidence, refusal, tool calls, and token use.
- Outcome data such as corrections, conversions, verified labels, and escalations.
- Operational measures including latency, errors, queue depth, and cost.
Store a versioned evaluation set beside this baseline. Keep difficult, high-impact, and historically common examples represented. A broad average can hide severe regression on a small but important customer group.
baseline = {
  "window": "representative stable period",
  "routing_accuracy": 0.91,
  "override_rate": 0.07,
  "high_risk_misroutes": 0.002,
  "p95_latency_ms": 1800,
  "input_language_mix": {"en": 0.72, "es": 0.16, "other": 0.12}
}
🧪 5. Start with a small, trustworthy evaluation stream
Production labels are often delayed, incomplete, or biased toward cases that someone reviewed. Do not wait for perfect labels; create a small ongoing evaluation stream that you trust.
Sample live requests across user segments, risk levels, and input types. Have qualified reviewers evaluate them against a written rubric, with sensitive data minimized or protected according to your organization’s rules.
- Define what a correct, useful, and safe result looks like.
- Randomly sample routine traffic and deliberately sample high-risk traffic.
- Blind reviewers to model version where practical.
- Measure reviewer agreement and clarify ambiguous rubric items.
- Track results over time, not just as one aggregate score.
Even a modest weekly sample can detect important movement when paired with strong operational signals.
📥 6. Watch inputs before they become failures
Input drift is frequently the earliest observable sign. It may reveal a user behavior shift, a new product feature, a broken upstream transform, or an attack pattern.
For structured data, monitor null rates, category frequencies, numeric ranges, and schema changes. For text, monitor language mix, length, source channel, repeated templates, topic clusters, and the rate of malformed content.
def input_features(request):
    return {
        "chars": len(request.text),
        "language": detect_language(request.text),
        "source": request.source,
        "has_attachment": bool(request.attachment),
        "missing_account_id": request.account_id is None
    }
Do not log raw customer text by default merely because it is convenient. Prefer derived, privacy-preserving features, approved samples, redaction, restricted access, and defined retention periods.
📊 7. Monitor output distributions, not just accuracy
A system can produce outputs for every request while becoming oddly narrow, overconfident, or refusal-heavy. Output distributions often move before enough ground truth arrives to calculate true quality.
For classifiers, compare predicted classes and confidence bins. For generative systems, track answer length, structured-output validity, tool-call frequency, citation use, refusal rate, retry rate, and the share of responses that trigger a safety or quality check.
- A sudden increase in one category can indicate input shift or threshold trouble.
- A confidence spike can signal calibration issues, leakage, or changed inputs.
- More refusals can reflect policy changes, prompt injection, or retrieval failure.
- Shorter answers can result from truncation, timeouts, or prompt changes.
These are clues, not verdicts. Pair them with request samples and outcome metrics before deciding the model is at fault.
🧮 8. Use simple statistical signals wisely
You do not need an advanced research stack to find early drift. Start by comparing a recent window with the baseline using stable, understandable measures.
| Signal | Useful for | Common caution |
|---|---|---|
| Percent change | Override, refusal, error, and cost rates | Small baselines can exaggerate change |
| Distribution distance | Categories, score bins, and numeric inputs | Detects change, not harm |
| Control limits | Metrics with regular historical behavior | Seasonality needs a comparable baseline |
| Segment comparison | Language, region, device, or customer tier | Small groups create noisy estimates |
| Human audit sample | Actual usefulness and nuanced safety | Requires a clear rubric |
Use alert thresholds with a minimum sample size. Alerting on a 50% change from two events to three events creates noise and causes people to ignore real warnings.
if requests_last_hour >= 200 and override_rate > baseline_override_rate * 1.4:
    create_alert("Override rate above expected range")
🧩 9. Segment every important metric
Aggregate metrics are reassuring until they are not. An overall quality score can remain flat while one language, product line, browser type, or customer group experiences a serious decline.
Choose segments tied to real differences in the task. Examples include acquisition channel, document type, device, geography where appropriate and lawful, user expertise, input language, risk tier, and workflow stage.
Do not create hundreds of dashboards without a hypothesis. Start with the segments where errors have the highest impact or where the underlying data is most likely to vary.
🧑💻 10. Treat user behavior as a model-quality sensor
People often notice drift before automated metrics do. Their behavior produces useful proxy signals when interpreted carefully.
- Agents editing an AI summary before sending it.
- Users rephrasing the same question repeatedly.
- Developers rejecting more generated code suggestions.
- Operators overriding predicted routes or risk scores.
- Customers abandoning a workflow after the AI response.
Proxies are imperfect. A rising edit rate might mean the model is worse, but it could also reflect a new writing policy or an interface change. Pair behavioral data with release annotations and qualitative review.
event = {
  "request_id": request_id,
  "model_output_id": output_id,
  "accepted": False,
  "edited": True,
  "override_reason": "wrong_department",
  "workflow_version": workflow_version
}
🪵 11. Log the full decision context
When drift appears, teams need to answer a basic question: what exactly produced this output? Logging only the final answer turns investigations into guesswork.
Capture the minimum necessary decision context: configuration versions, prompt template identifier, model identifier, retrieval corpus version, selected document IDs, tool outcomes, validation results, latency, and anonymized request features.
For a retrieval-augmented application, retrieval drift can look like model drift. If the index is stale, chunking changed, metadata filters fail, or relevant documents disappear, the generator may answer poorly despite being unchanged.
- Make every deployment and data refresh traceable.
- Correlate requests across the UI, orchestration layer, tools, and review workflow.
- Protect logs from unauthorized access and avoid retaining secrets.
- Test observability during staging, not during the first incident.
🔄 12. Track changes outside the model itself
Production AI behavior is an ecosystem property. The cause may be a prompt revision, a new default parameter, a tool API change, a retrieval update, a safety filter, an upstream schema migration, or a changed user interface.
Maintain a simple change calendar. Annotate monitoring charts with deployments, feature flags, data backfills, policy updates, marketing campaigns, and known external events.
change_record = {
  "time": "deployment timestamp",
  "component": "retrieval pipeline",
  "change": "updated document parser",
  "owner": "search team",
  "rollback": "restore prior parser configuration"
}
This is one of the highest-leverage habits in AI operations. A visible timeline can reduce an investigation from days to minutes.
🚨 13. Design alerts for investigation, not panic
An alert should tell a responsible person what changed, how large the change is, which segment is affected, and where to start looking. “AI quality is low” is not actionable.
Use tiers. A low-severity signal can create a review task; a sustained quality decline can page an owner; a high-risk safety or compliance failure may require immediate containment.
- Signal: structured-output validity drops in invoice PDFs.
- Scope: primarily documents from one upload source.
- Context: began after parser deployment.
- Suggested first check: compare parsed text and missing-field rates.
- Immediate guardrail: route invalid outputs to human review.
Set a review cadence for alerts that do not page anyone. Quiet, recurring warnings can reveal slow drift that urgency-based systems miss.
🕵️ 14. Investigate with a disciplined triage sequence
When a metric shifts, resist the urge to retrain immediately. First establish whether the signal is real and locate the change boundary.
- Confirm metric definitions, sampling, timestamps, and dashboard freshness.
- Compare the recent window with a seasonally or operationally comparable window.
- Break the shift down by segment, source, workflow version, and error type.
- Inspect privacy-approved examples from before and after the change.
- Review the change calendar and dependency health.
- Check delayed labels and human audits for actual quality impact.
- Choose the smallest safe intervention, then measure recovery.
Write down the hypothesis and evidence. This produces institutional knowledge rather than a collection of one-off fixes.
🛠️ 15. Choose the right remediation
Different drift sources require different fixes. Retraining is valuable, but it is not a universal repair button.
| Observed cause | Practical remediation |
|---|---|
| Broken upstream field mapping | Fix transform, backfill where needed, add schema tests |
| New user vocabulary or document format | Update examples, parsing, retrieval, prompt, or training data |
| Changed decision policy | Revise labels, thresholds, rubric, and stakeholder documentation |
| Retrieval relevance decline | Repair ingestion, metadata, chunking, ranking, or corpus freshness |
| Model quality decline on verified cases | Improve data and task design, then validate a replacement |
| High-risk uncertainty | Expand human review or safe fallback while investigating |
Validate any fix against the frozen evaluation set and a current sample. A repair for today’s issue can introduce a regression for a previously stable segment.
🧯 16. Build graceful fallbacks before you need them
Not every anomaly should result in an outage. Design a safe degraded mode for tasks where an uncertain answer is worse than a slower workflow.
Fallbacks can include a human-review queue, rules for a narrow high-confidence subset, a neutral “I need more information” response, cached verified content, or a previous validated configuration.
if validator_failed or risk_score > 0.8:
    route_to_human_review(request)
elif retrieval_confidence < 0.4:
    return ask_for_clarification()
else:
    return model_response
Test rollback and fallback paths regularly. A runbook that has never been exercised is an assumption, not a capability.
🧠 17. Handle generative AI drift differently
Generative systems add unique complications because there may be many acceptable answers and direct ground truth is often unavailable. Evaluate the task outcome, not just the wording of the output.
For example, a coding assistant can be measured by whether generated code passes tests, needs edits, introduces security concerns, or helps users complete a task. A support assistant can be assessed for grounded claims, correct action selection, policy adherence, and resolution outcome.
Evaluation rubric for an assistant answer:
1. Answers the user’s stated task
2. Uses approved source material when required
3. Makes no unsupported factual claim
4. Follows the applicable policy
5. Escalates when information is insufficient
Track prompt-injection attempts, unsupported-answer flags, citation mismatch, tool failures, and retrieval coverage. These can be early warnings that are invisible in fluency ratings.
⚖️ 18. Include privacy, fairness, and responsible-use checks
Monitoring can itself create risk. Collecting every prompt and response may expose personal data, confidential business information, credentials, or sensitive inferences.
Apply data minimization: log only what helps operate and improve the system, redact sensitive fields, restrict access, define retention periods, and ensure reviewers have appropriate authorization. Consult applicable legal, security, and organizational requirements for your context.
Also inspect whether drift affects groups differently. A language shift, new document format, or policy change can cause uneven error rates. Where permitted and meaningful, evaluate relevant segments and investigate material disparities rather than relying solely on global averages.
📋 19. Avoid the most common monitoring mistakes
- Watching only accuracy: labels arrive late, and many generative tasks lack one correct answer.
- Alerting without context: a metric change alone cannot identify the broken component.
- Using averages only: localized failures disappear in aggregate results.
- Retraining on unreviewed feedback: user behavior can be noisy, adversarial, or biased.
- Ignoring data quality: many “model incidents” are pipeline incidents.
- Overreacting to one day: investigate persistence, sample size, and seasonality.
- Skipping rollback plans: remediation becomes risky during a live incident.
Good drift detection is a socio-technical practice. It combines monitoring, product judgment, data engineering, review processes, and clear ownership.
✅ 20. Use this quick-start checklist
- Write down the AI task, decision impact, and failure modes.
- Choose one primary quality metric, one guardrail metric, and two operational metrics.
- Capture a representative baseline with configuration and data context.
- Instrument input features, output patterns, user corrections, and system events.
- Create a small recurring human evaluation sample with a written rubric.
- Segment metrics by the dimensions most likely to differ.
- Annotate dashboards with releases, data changes, and external events.
- Create tiered alerts with owners, first checks, and safe fallbacks.
- Practice investigation and rollback before a high-impact incident.
- Review thresholds and evaluation sets as the product and users evolve.
The earliest signs of model drift become manageable when you treat production AI as a living system: measure its context, listen to its users, and respond with evidence rather than guesswork. 📈🛡️🤖