
This can be regarded as a more general approach to representing uncertainty than the Bayesian approach.
Bayesian methods are sometimes inappropriate:
Let A represent the proposition Demi Moore is attractive.
Then the axioms of probability insist that ![]()
Now suppose that Andrew does not even know who Demi Moore is.
Then
- We cannot say that Andrew believes the proposition if he has no idea what it means.
- Also, It is not fair to say that he disbelieves the proposition.
- It would therefore be meaningful to denote Andrew’s belief of B(A) and
 as both being 0.
 - Certainty factors do not allow this.
Dempster-Shafer Calculus
The basic idea in representing uncertainty in this model is:
- Set up a confidence interval — an interval of probabilities within which the true probability lies with a certain confidence — based on the Belief B and plausibility PL provided by some evidence E for a proposition P.
- The belief brings together all the evidence that would lead us to believe in P with some certainty.
- The plausibility brings together the evidence that is compatible with P and is not inconsistent with it.
- This method allows for further additions to the set of knowledge and does not assume disjoint outcomes.
If ![]() is the set of possible outcomes, then a mass probability, M, is defined for each member of the set
is the set of possible outcomes, then a mass probability, M, is defined for each member of the set ![]() and takes values in the range [0,1].
and takes values in the range [0,1].
The Null set, ![]() , is also a member of
, is also a member of ![]() .
.
NOTE: This deals wit set theory terminology that will be dealt with in a tutorial shortly. Also see exercises to get experience of problem solving in this important subject matter.
M is a probability density function defined not just for ![]() but for em all subsets.
but for em all subsets.
So if ![]() is the set { Flu (F), Cold (C), Pneumonia (P) } then
is the set { Flu (F), Cold (C), Pneumonia (P) } then ![]() is the set {
is the set { ![]() , {F}, {C}, {P}, {F, C}, {F, P}, {C, P}, {F, C, P} }
, {F}, {C}, {P}, {F, C}, {F, P}, {C, P}, {F, C, P} }
- The confidence interval is then defined as [B(E),PL(E)]
where
where i.e. all the evidence that makes us believe in the correctness of P, and
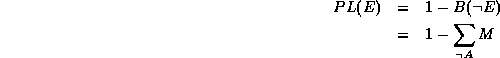
where i.e. all the evidence that contradicts P.
Combining beliefs
- We have the ability to assign M to a set of hypotheses.
- To combine multiple sources of evidence to a single (or multiple) hypothesis do the following:
- Suppose
 and
and  are two belief functions.
 - Let X be the set set of subsets of
 to which assigns a nonzero value and letY be a similar set for
 - Then to get a new belief function
 from the combination of beliefs in and we do:
- Suppose
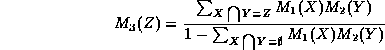
whenever ![]() .
.
NOTE: We define ![]() to be 0 so that the orthogonal sum remains a basic probability assignment.
to be 0 so that the orthogonal sum remains a basic probability assignment.